
How to track views of your restaurant QR code menu
Want to know how many people view your restaurant menu? Atablo lets you track online menu views, visitors and trends. Identify your busiest days and see how traffic to your digital menu changes over time.
Check your statistics in Atablo
-
Open your restaurant statistics
Sign in to Atablo and open the Statistics page for the restaurant you want to analyse. Your restaurant must be online to receive public visits.
-
Choose a period
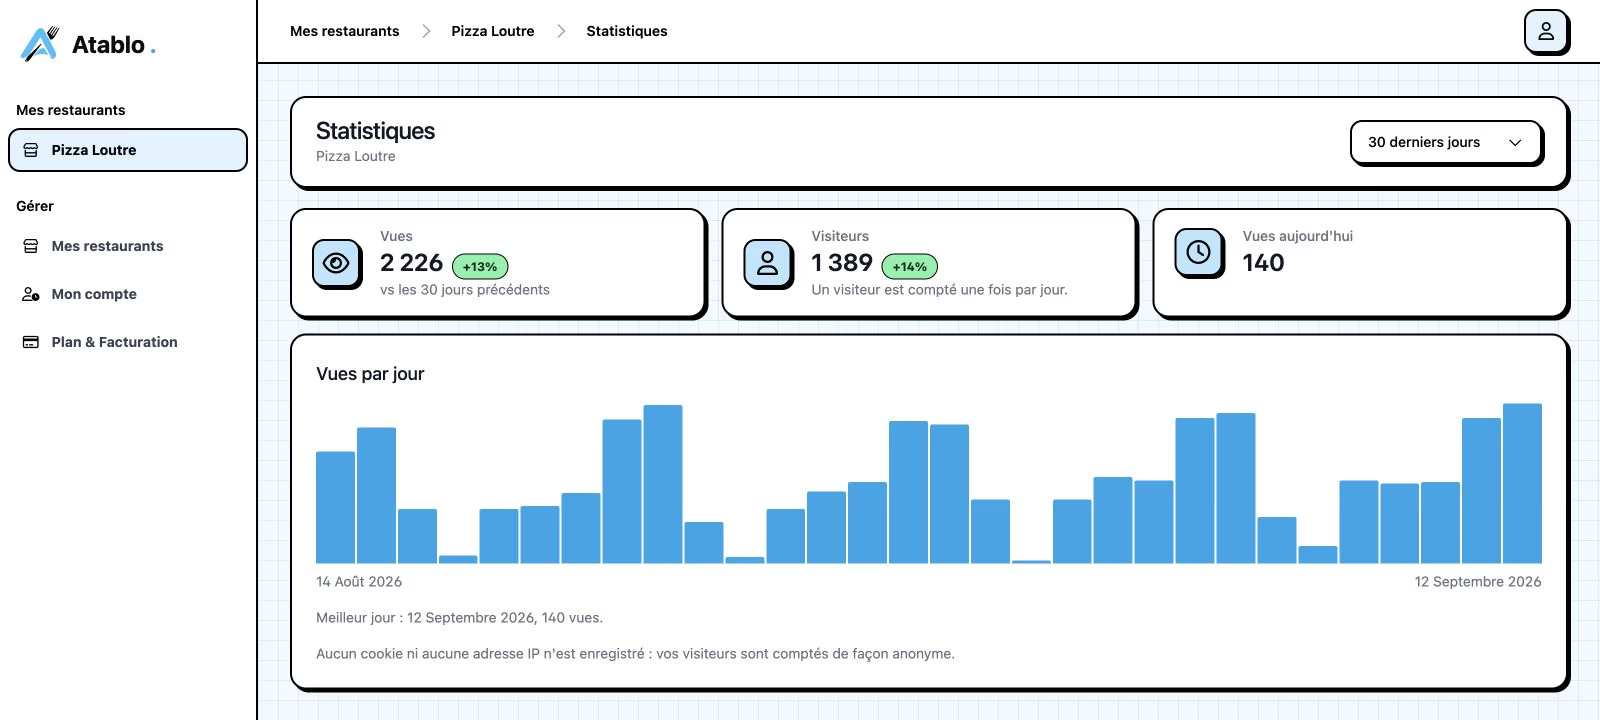
Select the last 7, 30 or 90 days using the period selector.
-
Read the indicators
Check the views and visitors for your chosen period, along with today’s views.
-
Identify your busiest days
The chart shows views day by day. Use it to spot differences between days of the week.
-
Compare with the previous period
When a comparison is available, check the displayed trend. A 30-day period is compared with the preceding 30 days.
Understand your menu traffic
Views count visits to your restaurant’s public page, whether opened through a QR code or a shared link. They do not exclusively count QR code scans.
A visitor is counted once per day. Someone returning on several days counts on each day, so a monthly total is not a count of unique people for that month.
Statistics cover the restaurant page as a whole. They do not separate lunch menu views from dinner menu views.